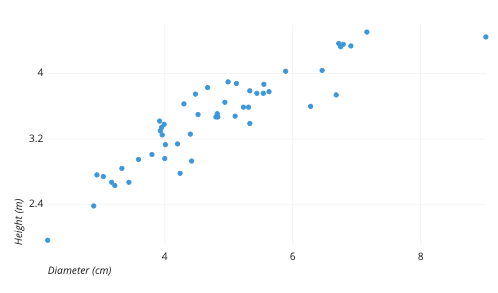
How to make a chart on Google Sheets?
Learn how to make a chart on Google Sheets. Google sheets also allows several customizations on chart.

Google Sheets is a cloud-based spreadsheet program offered by Google as part of the Google Drive suite of web-based office applications. It allows users to create, edit, and collaborate on spreadsheets online, without needing to download or install any software.
To make a chart on Google Sheets, follow these steps:
- Open a new or existing Google Sheets document.
- Enter the data you want to use for the chart in a table format, with each column and row representing a data point. Make sure to include headers for each column.
- Select the data range that you want to use for the chart.
- Click on the "Insert" menu at the top of the screen.
- Select "Chart" from the drop-down menu.
- Choose the type of chart you want to create, such as a column chart, line chart, or pie chart. You can also select the "Recommended" tab to see chart types that Google Sheets suggests based on your data.
- Customize the chart by choosing the style, layout, and color options that you prefer.
- Click "Insert" to add the chart to your Google Sheets document.
Moreover, you can also edit and format the chart by clicking on it and using the chart editor, which will appear on the right side of the screen. From there, you can adjust the data range, chart type, and various formatting options. The chart will update automatically based on any changes you make.


