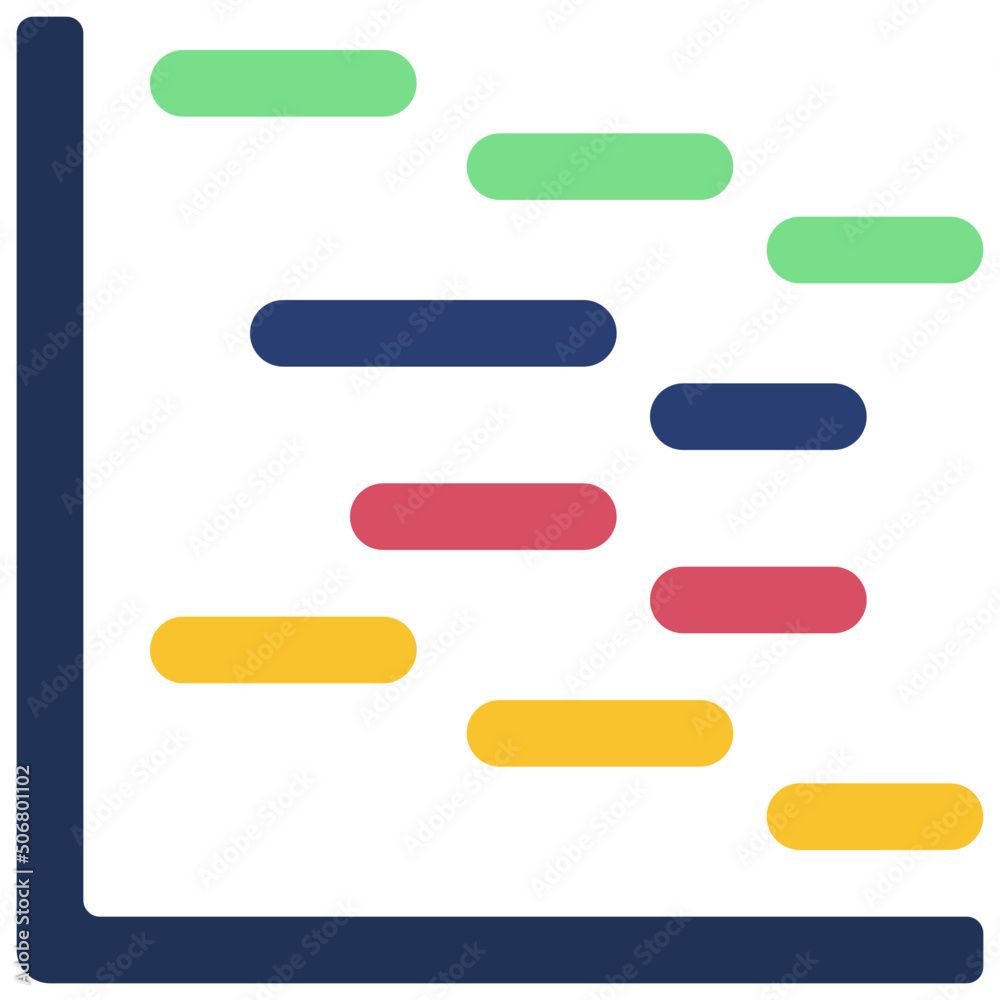
How to Make a Gantt Chart in Google Sheets?
Learn to Make a Gantt Chart in Google Sheets. The step-by-step guide for making a Gantt Chart are: Create a new sheet> Set up your columns> Add your tasks> Add a chart> Format your chart and Share your chart.
Google Sheets is a great tool for creating Gantt charts, the simple steps for making a Gantt Chart in Google Sheets are:
- Create a new sheet :To start creating a Gantt chart in Google Sheets, open a new sheet by going to the Google Sheets homepage and clicking on the "Blank" option.
- Set up your columns: Next, set up your columns to represent the different aspects of your project. Typically, a Gantt chart will have columns for task name, start date, end date, duration, and progress. You can do this by typing the column headers into the first row of your sheet.
- Add your tasks: Once you have set up your columns, start adding your tasks to the sheet. Enter the task name, start date, end date, duration, and progress for each task. You can also use the formatting tools in the toolbar to make your Gantt chart more visually appealing.
- Add a chart: To turn your sheet into a Gantt chart, go to the "Insert" menu and select "Chart." Choose "Gantt chart" from the list of chart types, and select the data range you want to use for your chart. You can also customize the appearance of your chart by choosing a title, changing the colors, and adjusting the legend.
- Format your chart: Once you have added your chart to the sheet, you can format it further to make it more visually appealing and easier to read. You can adjust the time scale, add milestones, and change the layout of your chart to suit your needs.
- Share your chart: Finally, you can share your Gantt chart with others by clicking on the "Share" button in the top right-hand corner of the page. You can then enter the email addresses of the people you want to share the chart with and set the level of access they have (view, comment, or edit).
In conclusion, by following the steps outlined above, you can create a Gantt chart that helps you track progress and manage your projects more effectively.