How to Make Graphs in Google Sheets?
Learn to Make Graphs in Google Sheets. For making Graphs in Google Sheets: Enter data into a spreadsheet> Select the data> Click "Insert Chart> Choose a chart type> Customize the chart> Add the chart to your sheet and Share your chart.

Google Sheets is a versatile and easy-to-use online spreadsheet program that allows users to create and manipulate data in a variety of ways, including the creation of graphs and charts. The steps to make Graphs in Google Sheets includes:
- Enter data into a spreadsheet: Before creating a graph, you need to have data to represent. Enter the data into the spreadsheet, making sure to label the columns and rows.
- Select the data: Click and drag your cursor over the data you want to include in your graph. You can also select the entire sheet by clicking on the box to the left of the column and above the row headers.
- Click "Insert Chart.": Once you have selected the data you want to include, click "Insert" on the menu bar, and select "Chart" from the dropdown list.
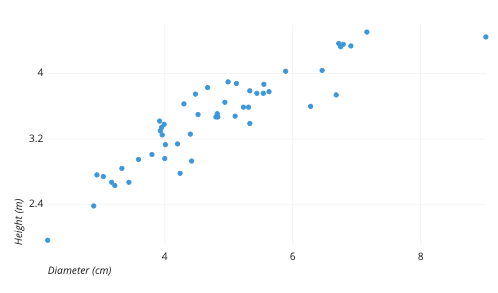
- Choose a chart type: Google Sheets offers a variety of chart types, including column, line, pie, scatter, and more. Select the type of chart that best represents your data.
- Customize the chart: Once you have selected the chart type, you can customize the chart by adding a title, changing the axis labels, adjusting the colors, and more. You can do this by clicking on the chart and using the toolbar that appears.
- Add the chart to your sheet: Once you have customized your chart, you can add it to your sheet by clicking on the "Insert" button at the bottom of the chart editor.
- Share your chart: Once your chart is complete, you can share it with others by clicking on the "Share" button at the top right of the screen. You can choose to share the chart with specific people or make it available to anyone with the link.
In the nutshell, with just a few clicks, you can customize your chart and share it with others to help them better understand your data.